 |
||||||
 |
||||||
|
||||||
|
|
||||||
|
||||||||||||||||||||||||||||||||||||||||||||||||||||||||||||||||||||||||||||||||||||||||||||||||||||||||||||||||||||||||||||||||||||||||||||||||||||
Troubleshooting with Activity MonitorActivity Monitor, located in the Macintosh HD > Applications > Utilities folder, is particularly suited to troubleshooting performance problems, such as the Spinning Beach Ball of Death (SBBOD) and general system sluggishness. For example, Activity Monitor can be used to determine if your Mac has sufficient resources — CPU, RAM, and free space on your startup disk — for your daily workload. If your Mac regularly performs poorly or your work is frequently interrupted by the SBBOD, your computer may be lacking in one or more of these necessary resources. This is especially true if your work primarily involves notoriously resource-intensive applications, such as multimedia editing, financial modeling, or scientific computing. To learn all that Activity Monitor can do, read its Help: in Activity Monitor, choose Help > Activity Monitor Help. This FAQ discusses using Activity Monitor to troubleshoot performance problems. It includes the following topics:
Activity Monitor basicsTo open Activity Monitor, double-click its icon in the Macintosh HD > Applications > Utilities folder.
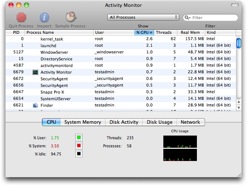
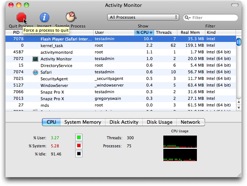
The top section of the Activity Monitor window is dominated by the process list. This list shows both open applications and background — aka system — processes. Technically, the operating system regards both user applications and system processes simply as processes. You can adjust the size of the process list by dragging the sizing handle in the lower-right corner of the Activity Monitor window. You can choose the columns of data shown in the process list in the View > Columns menu. You can sort the process list by clicking column headings until they appear in the desired order; the current sort column is highlighted and contains an arrowhead denoting the order. You can choose the frequency at which information in the Activity Monitor window is updated in the View > Update Frequency menu. The bottom section of the Activity Monitor window contains tabs for displaying different panes of information. The tabs are labeled CPU, System Memory, Disk Activity, Disk Usage, and Network. Clicking a tab displays a pane of information about that aspect of your Mac. Each pane shows associated real-time statistics and one or more related graphs. Choices in the View > Dock Icon menu can set the Dock icon for Activity Monitor to display one of the graphs for easier monitoring of a specific parameter, such as CPU usage or System Memory. Details will be provided later in this FAQ. Advanced users may note that Activity Monitor is a Graphical User Interface (GUI) to many of the statistics provided by the Terminal command top. Checking CPU usageThe Central Processing Unit (CPU), aka processor, is the part of your Mac that executes instructions, such as running the operating system and applications. It is the engine of your Mac. Unfortunately, if the CPU does not have the horsepower required for your type of work, your Mac will perform poorly and you may be frequently interrupted by the SBBOD. To see if your CPU is up to the task:
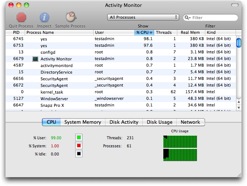
The left side of the CPU pane shows the percentage of CPU used by different process categories. The two most important are % User — processes running in logged-in accounts — and % System for system-related processes. To see a definition for a category, hover the mouse pointer over the label, e.g. % User, and a help tag will appear. The right side of the CPU pane displays one or more dynamic graphs — time series — showing CPU usage over time, color-coded by process category. There is one graph for each processor core, indicating the CPU usage in that given core. In addition to the CPU pane, Activity Monitor offers two additional methods of watching CPU usage: in the Dock icon for Activity Monitor itself or in a persistent or floating window.
Note that the persistent or floating CPU usage windows may not appear if the Dock icon for Activity Monitor has been set to Show CPU Usage. If your CPU is not up to the task, you must either upgrade to a new Mac or attempt to conserve CPU resources by running fewer applications concurrently. Checking RAM usageApplications and processing on your Mac require physical random-access memory (RAM). The more applications you open or the larger the files those applications work upon, the more RAM is consumed. To use the available RAM efficiently, Mac OS X employs Virtual Memory (VM). This includes dynamic paging: maximizing available RAM by moving data from RAM to swap files on the startup disk and back. The less RAM you have, the more CPU cycles and free space on your startup disk are devoted to paging and swap files, respectively. To determine if your Mac has sufficient RAM:
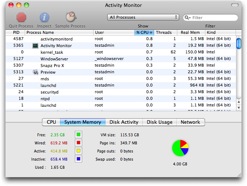
The left side of the System Memory pane shows memory use in different categories. To see the definition of a category , hover the mouse pointer over the label, e.g. Free, and a help tag will appear. The categories are also defined in the AppleCare Knowledge Base document "Mac OS X: Reading system memory usage in Activity Monitor." Of these categories, Free and Page Outs are the most important. If Free is low and Page Outs is consistently high during your work day, more RAM will help. The right side of the System Memory pane shows a pie chart of RAM usage. As noted earlier, more green — Free RAM — is better. If the green section is a sliver, more RAM is recommended. As with CPU usage, you can ease RAM monitoring by setting the System Memory pie chart as the Dock icon for Activity Monitor. To do this, perform one of the following tasks:
To remove all doubts about the adequacy of the RAM installed in your Mac, you can use Terminal to check an important RAM statistic that is omitted from the System Memory pane: page-ins and page-outs per second. This will further rule out slow performance due to thrashing, a condition where Free RAM is so low that paging monopolizes CPU activity. See our "Problems from insufficient RAM and free hard disk space" FAQ for details. If Free RAM is low, thrashing will also show up as persistently high values in the Disk Activity pane of Activity Monitor. See "Checking disk activity" later in this FAQ. If your Mac needs more RAM, add as much RAM as your budget will allow, up to the limit your Mac will accept. You can never have too much RAM. Free vs. available RAMSome may ask whether a shortage of Free RAM indicates the need for more RAM; they may argue that available RAM is a better measure of RAM sufficiency. Available RAM is the sum of the Free and Inactive memory shown in the System Memory pane. Free RAM is just that: RAM that is not being used. Inactive memory lives in a twilight zone between Free and Active memory. Whether memory is Active or Inactive depends on how recently it was accessed, where recently is defined by undisclosed parameters of the VM system itself. For example, memory allocated to the current — frontmost — application that you are using is included in Active memory. Memory allocated to applications that you have opened, but not accessed recently, may be included in Inactive memory. If you switch to an application whose memory is Inactive, that memory becomes Active. If Free memory drops below a certain threshold — again undisclosed — the VM paging system frees Inactive memory via a page-out, copying some of the contents of Inactive memory to disk by writing them to a swap file, then switching that Inactive memory to Free memory. If you switch to an application whose allocated memory has been paged-out to a swap file, Active memory must be allocated for a page-in, where the contents of that application's memory on the swap file are copied back to RAM. Depending on the amount of Free memory, a page-in may first require more page-outs from Inactive memory to swap files. For ideal performance, your Mac should have enough RAM that paging is unnecessary. When paging becomes excessive due to insufficient Free memory, thrashing can result. Therefore, while available RAM is the sum of Free and Inactive memory, the amount of Inactive memory is always in a state of flux. Having a sizable amount of Free memory at all times is a good proxy for gauging whether or not you have enough RAM for your daily workload. Readers who are interested in additional details should review the following Apple Developer documents:
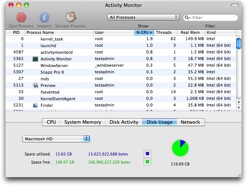
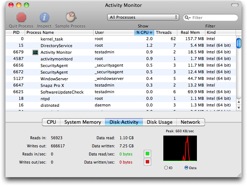
Checking free space on the startup diskFree space on your startup disk is important if your Mac has less RAM than your work demands. Free space is required for the swap files used in managing VM and for the scratch or temporary files often employed by multimedia editing applications. A lack of free space, especially when combined with insufficient RAM, can lead to poor performance due to thrashing, as well as host of other problems. To check the free disk space on your startup disk:
If the startup disk has insufficient free space, attempt to free up space by following the advice in our "Freeing space on your Mac OS X startup disk" FAQ. As a rule of thumb, 10 GB is the minimum amount of free disk space, but far more is better. Otherwise, you will need to upgrade the startup disk in your Mac to a larger hard disk drive. If free startup disk space is visibly and significantly disappearing during your work day that cannot be explained by normal activity, such as new files you are creating or downloading, then an errant process may be writing incessantly to Console logs. See "Checking disk activity" later in this FAQ for details. Checking disk activityProblems of thrashing or mysteriously disappearing free space on your startup disk may be confirmed by checking the Disk Activity pane in Activity Monitor:
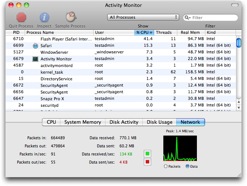
Checking network activityFrom a troubleshooting standpoint, the Network pane of Activity Monitor may at first seem to be the least useful. Both Network Utility — located in the Macintosh HD > Applications > Utilities folder — and the Network Diagnostics feature of Mac OS X are more suited to troubleshooting network-related issues. Nevertheless, the Network pane can be useful in determining if unexpected network activity is occurring. Unexpected network activity can be due to anti-piracy features in applications as well as unauthorized transmissions from malware or spyware. To check for unexpected network activity:
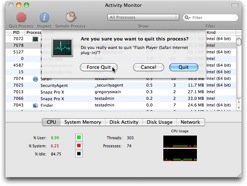
Note that the # Ports, Messages Sent, and Messages Received columns — choices in the View > Columns menu — do not relate to network activity: they concern inter-process communication, i.e. communications between processes in the process list. Finding and terminating errant processesErrant processes are those that interminably monopolize the CPU. By consuming CPU resources, they deprive other processes of their share, slowing performance and often resulting in frequent, protracted appearances of the SBBOD in all applications. The cooling fans in your Mac will eventually spin up as the CPU heats from the heavy — albeit useless— workload it is performing. Processes can become errant when they are frozen or hung, either due to programming bugs or system-related problems, such as directory corruption. In the process list, the process' name will appear in red text with the phrase Not Responding appended and its % CPU value will be very high, e.g. near or exceeding 100 percent. In an application's Dock menu, the phrase Application Not Responding will appear if the application is frozen or hung. Processes can also become errant due to unsupported system modifications, such as installing third-party hacks, interface modifications, or menu extras. Errant processes can also result from improperly uninstalling third-party applications. For example, if a third-party application installed a Startup or Login Item and you deleted all of the application's other files except that one, that leftover may still be opened when you start up your Mac or log in to your account, becoming an errant process that hogs CPU cycles. Some processes may occasionally display high % CPU usage protractedly, but this situation is not necessarily a problem. For example, processes associated with Spotlight® can show an extended spike in CPU usage during indexing, a time-consuming activity. A Web browser may show high CPU usage while rendering or displaying multimedia content. If a process is using considerable CPU, but its name does not appear in red text, it may simply be busy; patience is a virtue. To determine if an errant process is degrading performance:
Troubleshooting an errant system process requires an understanding of its function. To determine the function of an errant system process:
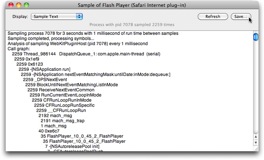
Advanced users can also terminate an errant process by using its Process ID or Process Name in the kill or killall Terminal commands, respectively. Sampling a processIf an application frequently becomes unresponsive, freezes, or hangs you can take a sample of it while it is in this state. A sample is essentially a snapshot of the code running in the process at the time the sample was taken. The sample can then be saved and sent to the developer for further analysis. To sample a process in Activity Monitor:
Note that the Sample function in Activity Monitor provides a GUI to the Terminal command sample. Related links• Problems from insufficient RAM and free hard disk space FAQ. |
||||||||||||||||||||||||||||||||||||||||||||||||||||||||||||||||||||||||||||||||||||||||||||||||||||||||||||||||||||||||||||||||||||||||||||||||||||
|
||||||||||||||||||||||||||||||||||||||||||||||||||||||||||||||||||||||||||||||||||||||||||||||||||||||||||||||||||||||||||||||||||||||||||||||||||||